US stocks have been outperforming international stocks for nearly all of the current bull market. From March 9, 2009 – August 5, 2013, the S&P 500 (SPY) has risen 124.34% compared to just 76.32% for the rest of the world (MSCI All Country World Index ex-United States: CWI). It follows that if you have a globally diversified portfolio, you may have noticed your US stocks outperforming your international holdings recently.
Considering that Europe is still in the mire and China is showing signs of slowing, it’s possible this trend could continue. Would it be wise, then, to move some money away from your international equity strategy and rebalance towards a more US-based strategy?
Before diving into that question, it’s important to consider how one should approach constructing an appropriate portfolio. Investing isn’t about putting all your money in the best performing asset class so as to generate the highest returns. This would likely result in a very concentrated and risky portfolio diversification strategy. Instead, since investors don’t know which sector, country, or category will outperform moving forward, it’s important to consider having exposure to various sectors and countries as part of a well-diversified portfolio.
How Have International Equities Performed?
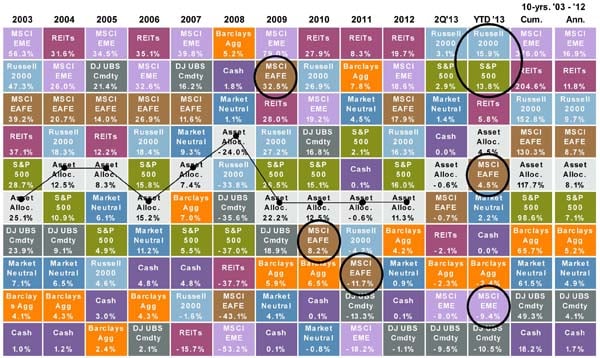
JP Morgan Asset Management’s chart below shows the performance of various asset classes such as the S&P 500, Emerging Markets, and Commodities. When looking at the international classes as represented by the MSCI EAFE (Europe, Australia, Far East) and MSCI EME (Emerging Markets), you’ll notice that they have not performed as well as the domestic S&P 500 or Russell 2000 indexes this year to date. (Click the chart to see a larger version.)
Source: Russell, MSCI, Jones, Standard Poor s, Suisse, Capital, NAREIT, FactSet, J.P. Asset Management. The “Asset Allocation” portfolio assumes the following weights: 25% in the S&P 500, 10% in the Russell 2000, 15% in the MSCI EAFE, 5% in the MSCI EMI, 25% in the Barclays Capital Aggregate, 5% in the Barclays 1-3m Treasury, 5% in the CS/Tremont Equity Market Neutral Index, 5% in the DJ UBS Commodity Index and 5% in the NAREIT Equity REIT Index. Balanced portfolio assumes annual rebalancing. All data represents total return for stated period. Past performance is not indicative of future returns. Data are as of 6/30/13, except for the CS/Tremont Equity Market Neutral Index, which reflects data through 2/28/13. “10-yrs” returns represent period of 1/1/03 – 12/31/12 showing both cumulative (Cum.) and annualized (Ann.) over the period. Click here to see disclosure page at end for index definitions. *Market Neutral returns include estimates found in disclosures. Data are as of 6/30/13.
This chart illustrates how a particular asset class that performed well one year may not necessarily perform as well the next year or in future years. For example, the MSCI EAFE was one of the top performing asset classes during 2009, however during the next two years, 2010 and 2011, several asset classes outperformed the MSCI EAFE.
The Problems with Chasing Past Performance and Concentrated Portfolios
Many investors decide to move out of one asset class and move into another at precisely the wrong time. For example, an investor might shift assets away from international stocks because they’re not performing well, when in fact they may be just about to start performing better than US stocks. Unfortunately, there’s no way to know when an asset class will outperform or underperform.
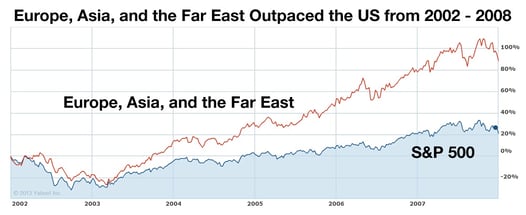
Using the MSCI EAFE (Europe, Asia, & the Far East) to chart international performance, you can see below that it wasn’t too long ago that international stocks were outperforming US stocks (S&P500). (Click the chart to see a larger version.)
 Source: Yahoo! Finance. Performance of the MSCI EAFE represented here by the ETF ETA; WrapManager Research
During this period, an investor would have been better off with a bias towards international equities versus US equities. These are just examples to help illustrate that no one category, country, or asset class is the best performer for all time and it’s impossible to know what lies ahead.
The key is building a properly diversified portfolio reflective of your investment plan.
What Should You Do with Your International Holdings?
Chasing the current hot performer may be tempting, but it usually does not end well over time. Impulsively selling an asset class from your portfolio could not only increase your overall risk by reducing the level of diversification, it could also cause returns to suffer.
At WrapManager, we believe it’s prudent to have a properly diversified portfolio based on your specific goals and situation. Give one of our Wealth Managers a call at (800) 541-7774 to review your current situation. Alternatively, you can get started with a few brief questions here.
Source:
i & ii Yahoo! Finance
Disclosure
The attached report and information have been prepared or produced by WrapManager, Inc. from sources and data believed to be reliable. Although these sources are deemed reliable we cannot guarantee its accuracy and the information may be incomplete or condensed. Information provided in this report is for educational and illustrative purposes only and should not be construed as individualized investment advice, as an offer to sell, or the solicitation of an offer to buy any security in any states where such an offer or solicitation would be prohibited by regulations. Past performance may not be indicative of future results. The views and opinions expressed do not constitute specific tax, legal, or investment or financial advice to, or recommendations for, any person, and the material is not intended to provide financial or investment advice and does not take into account the particular financial circumstances of individual investors. Before investing in any investment product, investors should consult their financial or tax advisor, accountant, or attorney with regard to their specific situation.
To the extent this article includes any federal tax advice, the presentation is not intended or written by WrapManager, Inc. to be used, and cannot be used, for the purpose of avoiding federal tax penalties. WrapManager, Inc. does not advise on any income tax requirements or issues. Use of any information presented by WrapManager, Inc. is for general information only and does not represent tax advice either express or implied. You are encouraged to seek professional tax advice for income tax questions and assistance.
No part of this article may be reproduced in any form without the express written permission of WrapManager, Inc. Opinions expressed are those of WrapManager, Inc. and are subject to change without notice and are not necessarily those of Prospera Financial Services, Inc., its directors, parent company or its affiliates. Securities offered through Prospera Financial Services and cleared through First Clearing, LLC. Prospera Financial Services - Member FINRA/SIPC.
No part of this article may be reproduced in any form without the express written permission of WrapManager, Inc.
© Copyright 2014, WrapManager, Inc. All rights reserved.


