

 Many investments view their fixed-income portfolio as a "safe haven" of sorts. Though each investor's goals are unique, fixed-income portfolios are often designed to help preserve principle, generate retirement income and potentially reduce overall portfolio volatility.
Just like you do with stocks, it’s essential to make sure your fixed income portfolio is diversified.
And although interest rates remain low,1 as Winston Churchill once said: "An optimist sees the opportunity in every difficulty."2 Take the time to work with your financial advisor to review your fixed income portfolio. Here are a few things to discuss.
Diversify Fixed Income Like Stocks
This is where your financial advisor comes in handy. By performing a review of your fixed income investments at least once per quarter, they can adjust your portfolio so it remains aligned with your individual investment goals and market conditions.
This involves making sure your fixed income investments are properly diversified. There is a wide range of fixed income asset classes, and each one performs and reacts to market conditions differently. Of course it's difficult, if not impossible, to predict with certainty which will perform best in a certain time frame, as illustrated by the following chart:
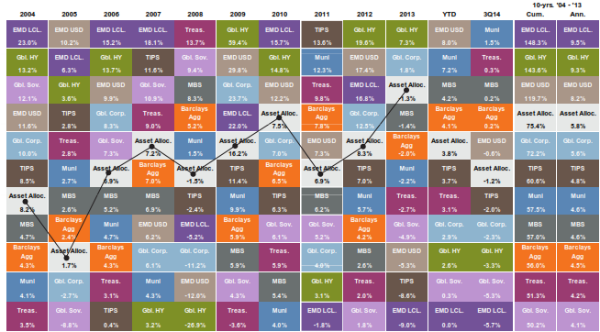
Source: Barclays Capital, FactSet, J.P. Morgan Asset Management. Past performance is not indicative of future returns. Fixed income sectors shown above are provided by Barclays Capital unless otherwise noted and are represented by Broad Market: Barclays Capital U.S. Aggregate Index; MBS: Fixed Rate MBS Index; Corporate: Gbl. Corporates; Municipals: Muni Bond 10-Year Index; Emerging Debt USD: J.P. Morgan EMBIG Diversified Index; Emerging Debt LCL: J.P. Morgan EM Global Index; Gbl. High Yield: Global Corporate High Yield Source: Barclays Capital FactSet J P Morgan Asset Management Past performance is not indicative of future returns Fixed income sectors shown above are provided by Barclays Index; Treasuries: Barclays Capital; U.S. Treasury; TIPS: Barclays Capital TIPS; Gbl. Sovereigns: Global Treasury ex U.S.. The “Asset Allocation” portfolio assumes the following weights: 20% in MBS, 20% in Gbl. Corporate,15% in Municipals, 5% in Emerging Debt USD, 5% in Emerging Debt LCL, 10% in Gbl. High Yield, 15% in Treasuries, 5% in TIPS, 5% in Gbl. Sovereigns. Asset allocation portfolio assumes annual rebalancing. Guide to the Markets – U.S. Data are as of 9/30/14.
In the chart you’ll notice that one asset class can perform well one year, and not as well the next year. The grey boxes with the connected line represent a diversified fixed income portfolio.
How Interest Rate Changes Can Affect Your Fixed Income Portfolio
Different fixed income asset classes are more sensitive to moves in interest rates than others. For example as the chart below shows, bonds with longer maturities are much more sensitive than those with lower maturities.
Price Impact of a 1% Rise/Fall in Interest Rates
(Click chart for larger version)
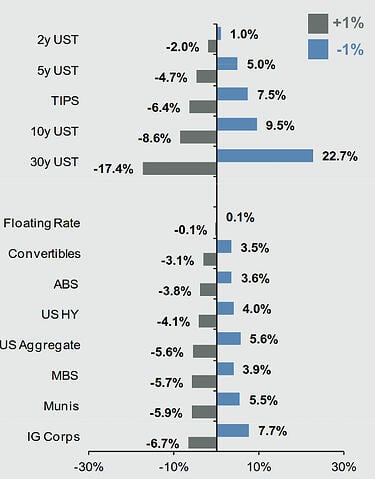
Source: U.S. Treasury, Barclays Capital, FactSet, J.P. Morgan Asset Management. Fixed income sectors shown above are provided by Barclays Capital and are represented by – Broad Market: Barclays U.S. Aggregate; MBS: U.S. Aggregate Securitized - MBS Index; Corporate: U.S. Corporates; Municipals: Muni Bond 10-year Index; High Yield: Corporate High Yield Index; TIPS: Treasury Inflation Protection Securities (TIPS). Floating Rate: Barclays FRN (BBB); Convertibles: Barclays U.S. Convertibles Composite; ABS: Barclays ABS CMBS. Treasury securities data for # of issues based on U.S. Treasury benchmarks from Barclays Capital. Yield and return information based on bellwethers for Treasury securities. Sector yields reflect yield to worst, while Treasury yields are yield to maturity. Correlations are based on 10-years of monthly returns for all sectors. Change in bond price is calculated using both duration and convexity according to the following formula: New Barclays FRN (BBB); Convertibles: Barclays U.S. Convertibles Composite; ABS: Barclays ABS + CMBS. Treasury securities data for#of issues based on U.S. Treasury benchmarks Price = (Price + (Price * -Duration * Change in Interest Rates))+(0.5 * Price * Convexity * (Change in Interest Rates)^2). *Calculation assumes 2-year Treasury interest rate falls 0.58% to 0.00%,as interest rates can only fall to 0.00%. Chart is for illustrative purposes only. Past performance is not indicative of future results. Guide to the Markets – U.S. Data are as of 9/30/14.
Which Fixed Income Investments are Best for You?
The key lies in properly diversifying (or adjusting if needed) your investment portfolio now with your financial advisor. There’s no one size fits all investment since you and your goals are unique.
Regular reviews can help your portfolio stay on track to align with your retirement planning goals, as well as adapt to current market conditions. Give one of our Wealth Managers a call today at (800) 541-7774 to discuss your fixed income portfolio and relevant wealth management strategies. If you don’t have an investment plan, you can get started on yours by answering a few questions here.


By Seton M. McAndrews, CFP®
Seton is a CERTIFIED FINANCIAL PLANNERTM professional and Vice President of Investments at WrapManager, Inc.
Sources:


