

Historically, equity markets have been very volatile in mid-term election years. Since 1962, the S&P 500 has had an average intra-year pullback of 19% in mid-term election years.1
The recent market pullback has wiped out 2018 gains and the S&P 500 is now roughly flat for the year. Again, historically the first 10 months of a mid-term election year are typically flat only to see a relief rally in the final 2 months of the year once the results of the election are known with certainty.
Will history repeat itself in 2018? While it is nearly impossible to forecast stock market returns over a specific time frame (particularly for a brief 2-month window), there are reasons to be optimistic going forward:
Corporate earnings remain strong3:
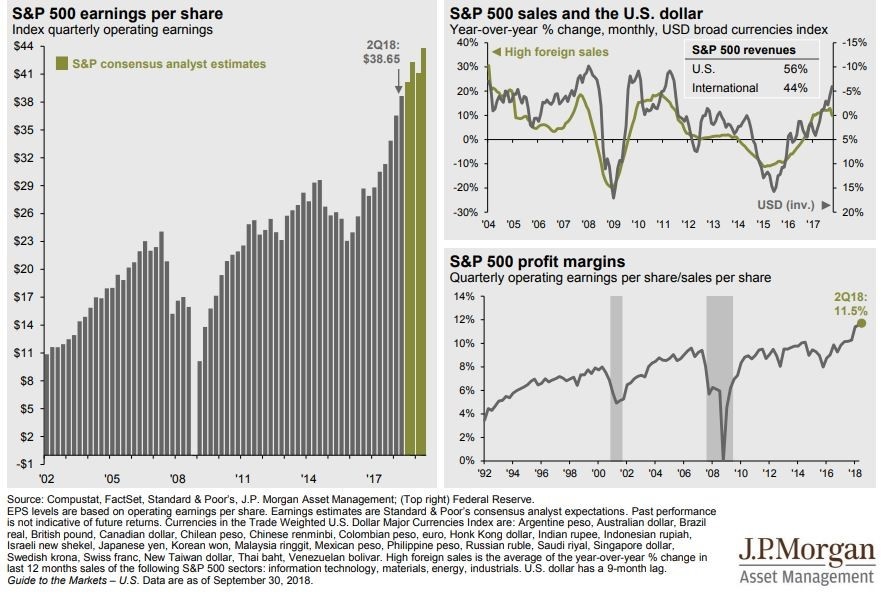
81% of the 140 companies in the S&P 500 that have reported third quarter earnings (as of October 23, 2018) posted earnings per share that beat Wall Street expectations, with only 10.7% of companies reporting earnings below expectations. Over the last 25 years, an average of 64% of companies reported earnings that beat Wall Street estimates with 21% of companies missing expectations.4
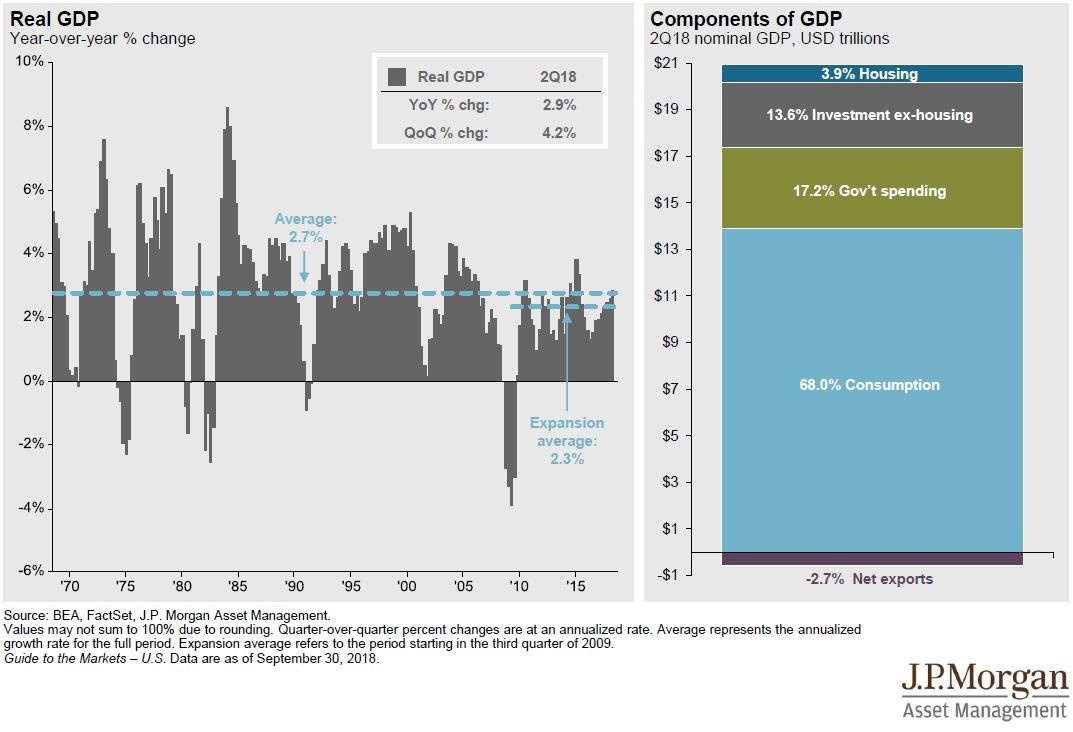
The economy remains on solid footing with Real GDP Growth of 2.9% (year-over-year)5
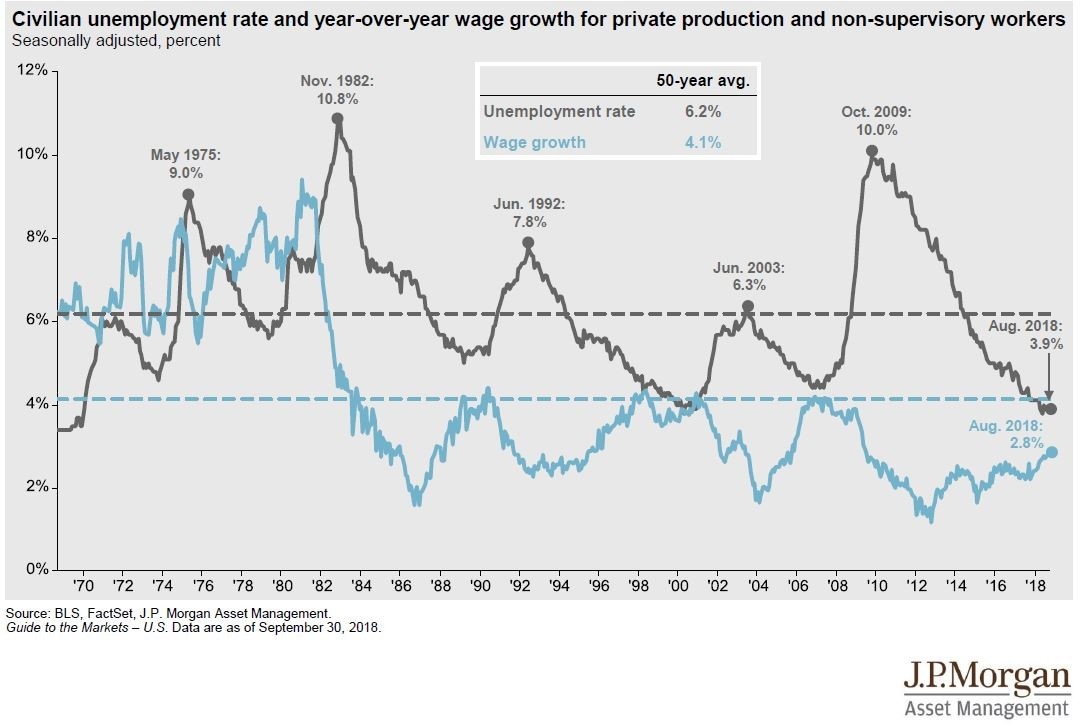
Unemployment remains low (3.9% in August 2018) and well below the 50-year average of 6.2%.6
Domestic equity markets being flat at this point in a mid-term election year shouldn’t be viewed as a reason to panic.
Historically, the year after the mid-terms has seen the best annual performance for stocks of the four-year election cycle. Since 1950, the post-midterm years has seen the S&P 500 return an average of 17.4%. By comparison, mid-term years have seen an average return of just 5.13%.7
In fact, the last time post mid-term year that experienced a negative return in the S&P 500 was all the way back in 1947.8
For long-term investors, possibly the biggest risk they face is a self-inflicted error such as panic selling during a market pull back when underlying market fundamentals are strong. While past performance is not indicative of future results, long-term investors should not base their investment decisions solely on short-term volatility.
About the Author: A member of the WrapManager Investment Policy Committee, Doug Hutchinson, CFA® is responsible for developing and refining our money manager due diligence and review standards. He is also responsible for monitoring and evaluating current and prospective money managers.
Doug graduated from the University of California, Santa Barbara with a BA in Business Economics. He is a CFA® Charterholder and an active member of the CFA® Society of San Francisco.
Sources:
1 Wells Fargo Investment Institute via Marketwatch
2 John Hancock Investments Q3 Market Intelligence Book (page 15)
3 JPMorgan Guide to the Markets 4Q 2018 (page 7)
4 Refinitiv via Marketwatch
5 JPMorgan Guide to the Markets 4Q 2018 (page 19)
6 JPMorgan Guide to the Markets 4Q 2018 (page 24)
7 John Hancock Investments Q3 Market Intelligence Book (page 15)
8 Strategas Securities via Wall Street Journal

