

Concerns over an inverted yield curve combined with the threat of higher tariffs around the globe have created some equity market volatility over the past few weeks. The ups and downs of equity market volatility can certainly be unnerving for investors, but volatility in and of itself is not necessarily a bad thing nor is it necessarily a signal of an upcoming recession.
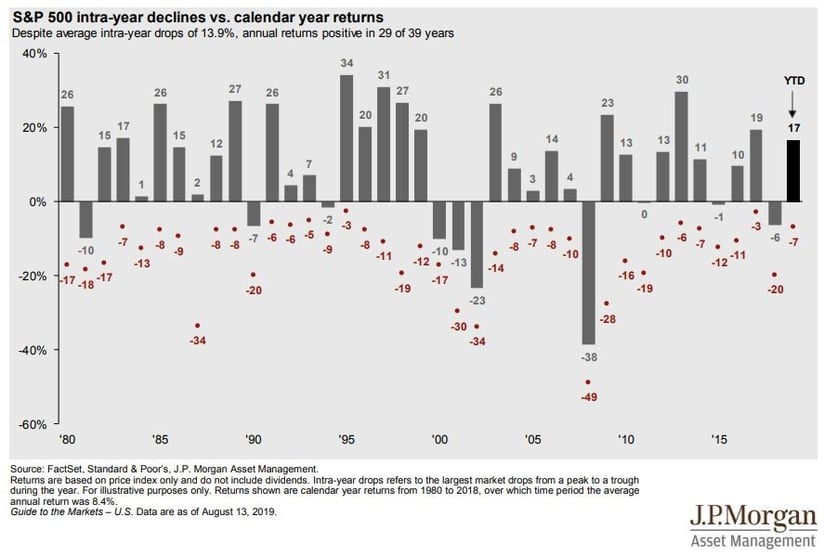
In fact, since 1980 the S&P 500 has suffered an average intra-year decline of 13.9% while the market has had positive returns in 29 of those 39 years.1
Should you Worry About an Inverted Yield Curve?
Historically, an inverted yield curve has preceded every recession in the U.S. for the last 50 years.2 An inverted yield curve occurs when short-term rates (such as the yield 2-year Treasury) are higher than longer term rates (such as the yield on the 10-year Treasury).
A yield curve might become inverted if investors are worried about the strength of the economy in the future. If an investor is willing to accept a lower interest rate in the future it is likely because they expect economic growth to be weak (or negative) in the future and that the central bank will reduce interest rates in the future to try to spur economic growth.
Some market analysts such as Dr. David Kelly of JPMorgan believe that a yield curve inversion is not as good of a barometer as it once was given that central bank asset purchases (also known as quantitative easing) have distorted the risk/reward profile of taking on duration risk.
“We do not believe that even a more general yield curve inversion would be as clear a recession signal as it has been in the past, as the yield curve itself has been distorted by unprecedented central bank buying of long-term bonds.” 3
In other words, having a substantial buyer of longer-term bonds (central banks) creates a downward pressure on longer term yields that was not present prior to quantitative easing. The yield curve could be inverted largely due to quantitative easing rather than concerns about the economy.
Should you Worry About a Recession?
While the yield curve inversion is potential risk on the horizon, there aren’t any other obvious signs that a recession is imminent.
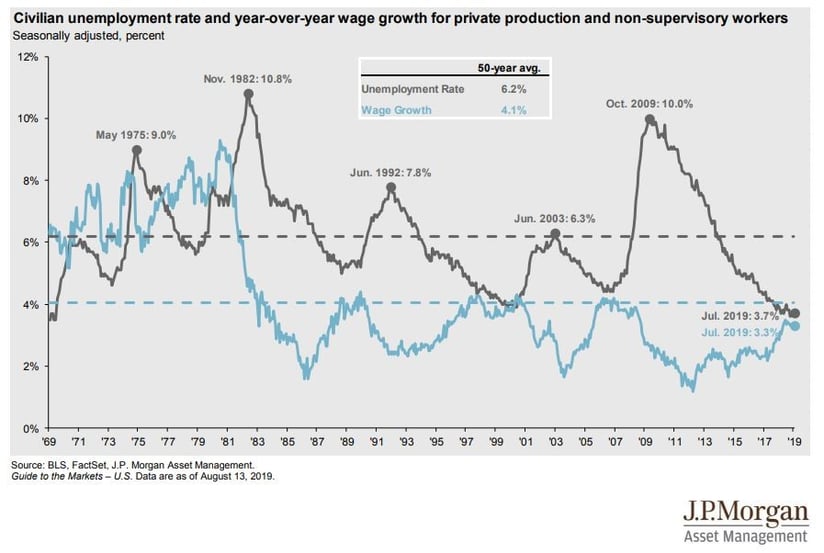
Employers added 164,000 jobs last month and the unemployment rate was 3.7% in July 2019 – a nearly 50-year low.4 This is well below the 50-year average unemployment rate of 6.2%.5
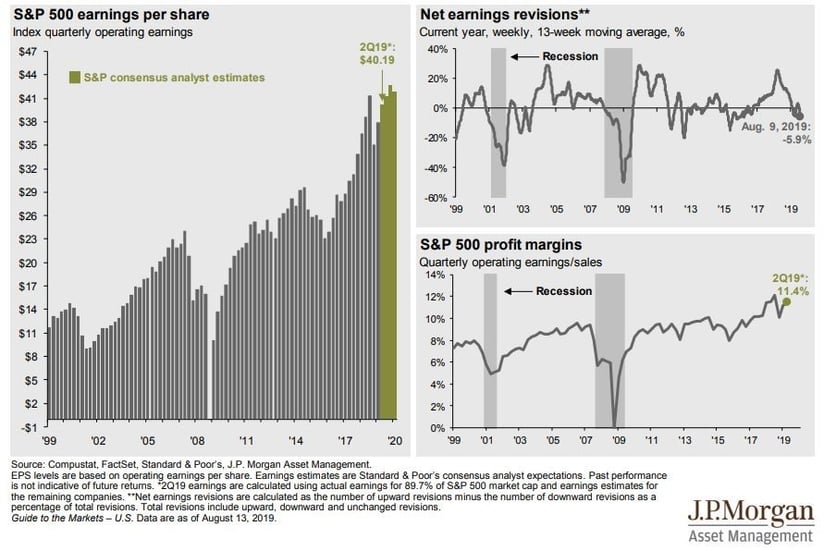
Corporate earnings remain strong and are forecast to remain strong6:
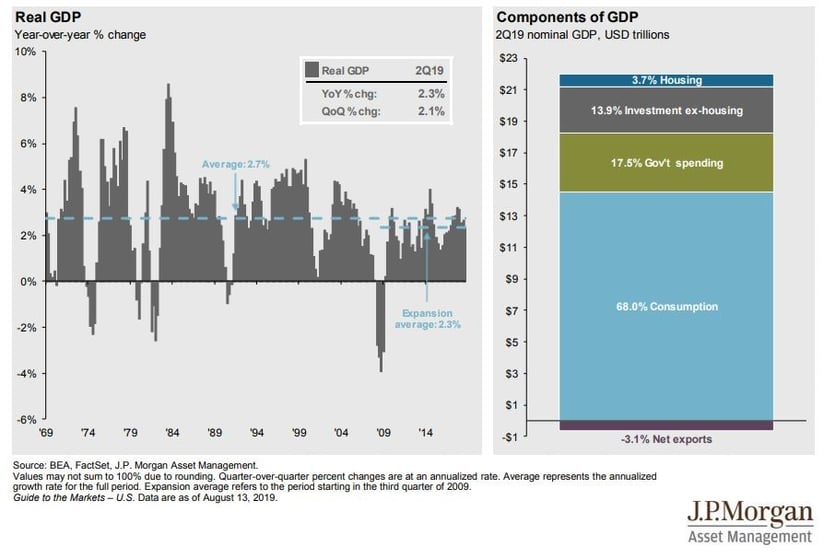
GDP Growth, although slowing, is still positive7:
Should I Sell All of my Equities because of the Inverted Yield Curve?
Over the previous 10 instances of the 2-year Treasury and 10-year Treasury inverting, the S&P 500 has declined by an average of 5.24% over the next 2 months following the inversion (although in 1980 there was not a decline at all following the yield curve inversion). After that initial drawdown, the S&P 500 has increased by an average of 16.7% over the next 6.7 months.8
An inverted yield curve should not be viewed as a signal to sell equities immediately.
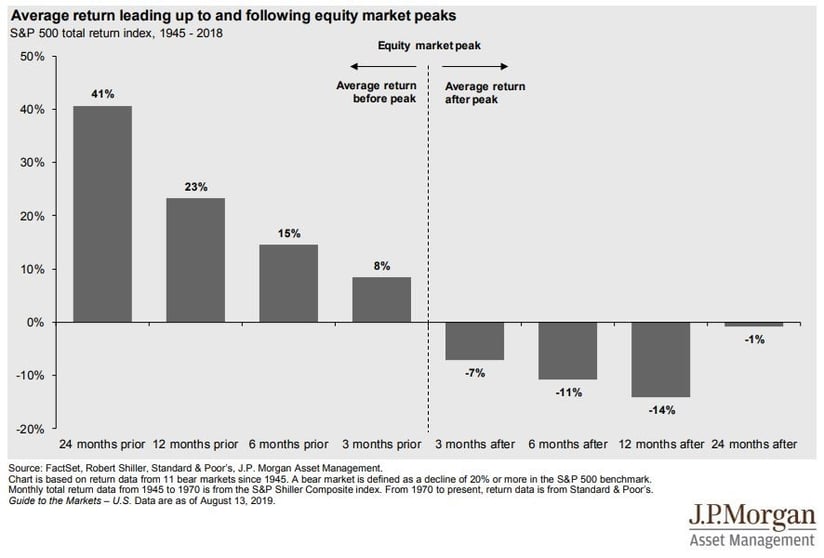
In fact, a market-timing investor who tries to sell out of equities in front of a market peak can run the risk of selling too early. In the 12 months prior to an equity market peak, the S&P 500 has returned an average of 23% in the year before the peak.
For long-term investors, possibly the biggest risk they face is a self-inflicted error such as panic selling during a market pull back when the underlying market fundamentals are strong. While past performance is not indicative of future results, long-term investors should not base their investment decisions solely on short-term volatility.
About the Author: A member of the WrapManager Investment Policy Committee, Doug Hutchinson, CFA® is responsible for developing and refining our money manager due diligence and review standards. He is also responsible for monitoring and evaluating current and prospective money managers.
Doug graduated from the University of California, Santa Barbara with a BA in Business Economics. He is a CFA® Charterholder and an active member of the CFA® Society of San Francisco.
Sources:
1 JPMorgan Guide to the Markets, August 13, 2019, Page 14
2 New York Federal Reserve Bank: Inverted Yield Curve and Recession Chart
3 JPMorgan: 2Q 2019 Update
4 NPR
5 JPMorgan Guide to the Markets, August 13, 2019, Page 23
6 JPMorgan Guide to the Markets, August 13, 2019, Page 7
7 JPMorgan Guide to the Markets, August 18, 2019, Page 18
8 Main Management: August Market Update
9 JPMorgan Guide to the Markets, August 13, 2019, Page 65

