

Global equity and bond markets have experienced heightened volatility over the last several months as elevated inflation readings and the prospect of higher interest rates has made the investment landscape appear treacherous.
This increased volatility can certainly be unnerving for investors but it is not necessarily unexpected, especially for a mid-term election year. Since 1980, the S&P 500 has an average intra-year decline of 14%.1 But the equity market drawdowns tend to be more severe in midterm election years, particularly in the months prior to Election Day. Research from Federated Hermes Investors found that “Leading up to Election Day, stocks tend to experience a pronounced pullback – 19% on average – before rallying afterward”2 in midterm years.
Historically investors have typically been rewarded for staying the course through the temporary pain of volatility during midterm years. Federated Hermes Investors found that “the S&P on average has risen 32% off the midterm election-year bottom. And it has not declined in the 12 months following a midterm election since 1946.”3
Avoiding the Temptation of Market Timing
While it may be tempting for investors to try and time the market by selling investments following a market decline and re-enter the market when things feel safer, investors should note that timing the market with such precision is extraordinarily difficult. JPMorgan highlights the pitfalls of a market timing strategy:
- “First, there is no guaranteed ‘signal’ to get out of the market, and market bottoms are only determined in hindsight.
- Second, the investor would need to buy in on the worst days during some of the most significant market drawdowns when loss aversion is at its greatest.
As a result, it is hard to believe that someone could be smart enough to consistently miss the worst days while courageous enough to invest for the best days.”4
Moreover, some of the days of best performance occur within weeks or even days of the worst days of performance and those good days are extremely important to recovering losses experienced on the worst days. The chart below from JPMorgan shows the cost of missing out on the best days of performance.
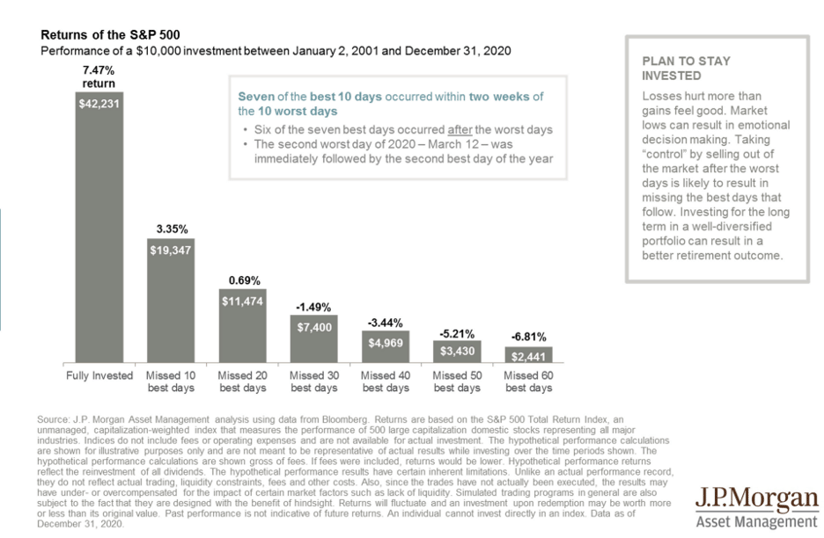
Timing a market re-entry is incredibly difficult as markets can bounce back extremely quickly and find a bottom long before things “feel safer.” The 2020 bear market featured a peak-to-trough decline of 34% in the S&P 500 but all of those losses were recovered just five months later.5 The market bottomed on March 23rd, 2020. A market timing investor with a plan to reinvest when things “feel safer” would probably not have chosen March 23rd as a re-entry point, as the CARES Act had yet to pass Congress and many pandemic related stay-at-home orders were just beginning in earnest.
Gaining a Better Perspective
To put things in perspective, it is also important to take a longer-term, multi-year view of investing. This chart below from JPMorgan shows rolling, multi-year returns of stocks, bonds and a 50/50 portfolio of stocks and bonds.
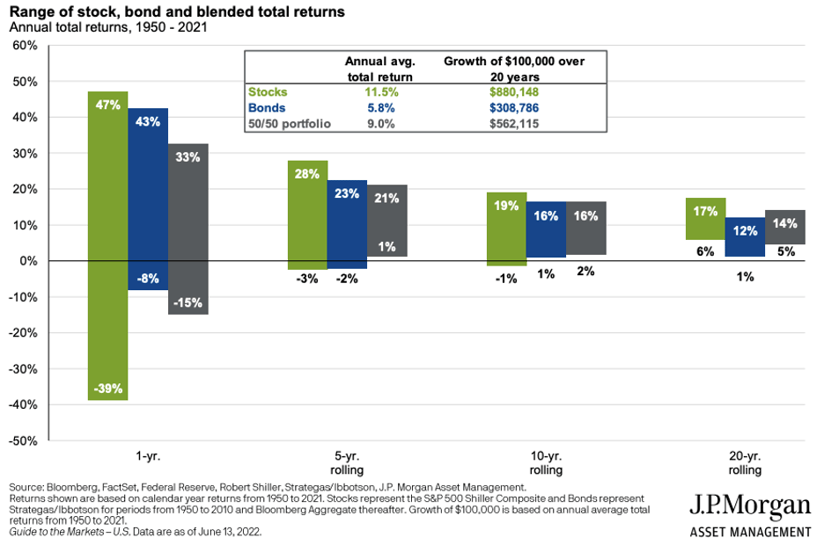
A single year in isolation can certainly be painful in a worst-case scenario. Since 1950, the worst one-year return for stocks is -39% and the worst one-year return for a 50/50 portfolio is -15%. Fortunately, long-term investors are not investing for a single year only. Since 1950, the worst-case scenario over 5 years for a 50/50 portfolio is an annualized return of 1% while the worst-case return for an equity portfolio is -3% annualized over 5 years.
Looking at 10-year and 20-year rolling returns highlight the strong long-term performance of stocks and bonds with the worst-case scenario for stocks being an annualized -1% over 10 years and an annualized 6% over 20 years, while the worst-case scenario of a 50/50 portfolio has been a 2% annualized return over 10 years and an annualized 5% return over 20 years.
“Doing Something”
During a downturn, investors might feel the need to “do something” to take control like selling out of the market since things like stock market declines, interest rate increases, and inflation readings are outside of investor’s control. However, if an investor’s plan to “do something” includes a market timing strategy, the investor may just end up doing further damage to their portfolio by locking in losses and missing the subsequent recovery.
Here are a couple of actionable items that an investor can do that do not involve employing a market timing strategy:
- Consider buying Series I Savings Bonds
As discussed in a previous blog post, Series I Savings Bonds can offer a good solution to investors who are concerned about rising inflation. Discuss with your Wealth Manager if these bonds make sense for your unique financial situation.
2. Consider Utilizing a Tax Loss Harvesting Strategy
The silver lining to any pullback is the potential ability to realize investment losses for tax purposes. Tax losses that are harvested can be used to offset future realized gains or to reduce your taxable income by up to $3,000 per year.6 Discuss with your Wealth Manager if a tax loss harvesting in your taxable investment account makes sense for your unique financial situation.
Market declines can certainly be painful, especially in a midterm election year where they have historically been more severe. But, for long-term investors, the biggest risk that they currently face may be an unforced error such as panic selling during a market pullback.
1 JPMorgan Guide to the Markets as of June 14th, 2022 Page 16
2 https://www.federatedinvestors.com/insights/article/-it-s-going-to-be-a-volatile-year.do
3 https://www.federatedinvestors.com/insights/article/-it-s-going-to-be-a-volatile-year.do
4 https://am.jpmorgan.com/us/en/asset-management/protected/adv/insights/market-insights/market-updates/on-the-minds-of-investors/is-market-timing-worth-it-during-periods-of-intense-volatility/
5 https://lplresearch.com/2022/05/23/what-happens-after-a-bear-market-starts-four-things-to-know/
6 https://www.irs.gov/taxtopics/tc409
This is a general communication being provided for informational purposes only. It is educational in nature and not designed to be taken as advice or a recommendation for any specific investment product, strategy, plan feature or other purpose in any jurisdiction. Any examples used are generic, hypothetical and for illustration purposes only. This material does not contain sufficient information to support an investment decision and it should not be relied upon by you in evaluating the merits of investing in any securities or products. In addition, users should make an independent assessment of the legal, regulatory, tax, credit, and accounting implications and determine, together with their own financial professional, if any investment mentioned herein is believed to be appropriate to their personal goals. Investors should ensure that they obtain all available relevant information before making any investment. Any forecasts, figures, opinions or investment techniques and strategies set out are for information purposes only, based on certain assumptions and current market conditions and are subject to change without prior notice. All information presented herein is considered to be accurate at the time of production, but no warranty of accuracy is given and no liability in respect of any error or omission is accepted. It should be noted that investment involves risks, the value of investments and the income from them may fluctuate in accordance with market conditions and taxation agreements and investors may not get back the full amount invested. Both past performance and yields are not reliable indicators of current and future results.

